D3 Basics
To get an overview of the basics of D3, you may want to check out this link
D3 assumes the users to have profficiency in HTML, CSS, Javascript, and SVG. You can see that visuals elements is abstracted by DOM. DOM used as a bridge between the visualization and html source. It avoid the programmatic html source, and using developer tools like in Chrome, we can hover the code.
With Chrome Developer Tools, we can access document (DOM) and window(Chrome) throught the Console.The Console is where we can play our DOM with Javascript native API. There are two ways where we can access node of DOM. we can select the element by id (getElementById) or we can access by CSS query (querySelector).The later is what D3 uses at core, but this is only the underground basics of level which D3 have comparable API access.This kind of query can also be exposed by JQuery.
This for comparable access through D3 APi, here's what simple access DOM node from D3:
d3.select('.viewer-main');
But this function would not return DOM node, instead return array with D3 object.This is useful when we using as based of our chainable object. The function will always return an object that we can keep modifying.Let's how chainable D3 looks like:
d3.select('header.navbar-static-top').style('background-color','green');
Notice that I usually add semicolon at the end of the line code. While it's optional for Javascript and Javascript at Chrome Console, you will need it if you're going to use D3.
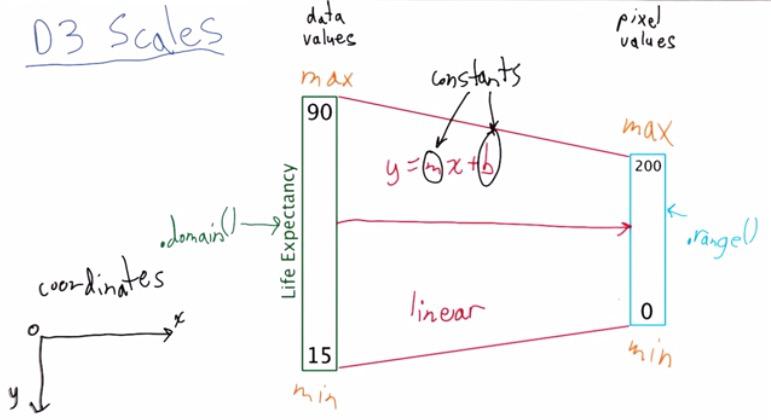
D3 can automatically scales your graphs according to your need. For using SVG, visualize your graph data on HTML, you want to take range of values of your data, and take range of pixels to put in your HTML. When we want to map by linear function from data(domain) to pixel(range) we use a gradient. Thankfully, D3 does the heavylifting of choosing the gradient and the bias value for us. All we need to do is present the range of our domain and range. The range, the pixels range, will be the offset of position on where we want to take our graph. Keep in mind that SVG is using top left corner as the (0,0) coordinate system.
svg.append('circle').attr('r',10).attr('fill','red').attr('cx',x(8347)).attr('cy',y(75))
Here are the examples when circle red svg on top right of the web page. The 'svg' variable is the class defined earlier when I want to apply svg through d3.append('svg').
D3 can also be manipulated as follows. When the user make a request to the server, usually the server send response to the users in form of html file. In that html file, there's actually Javascript function reside in it. You can make a callback function once the html rendered in users request, so it can request data in JSON throught AJAX to the server, then the server will give data json as a response, and use the data with the Javascript function that reside in HTML file.
For Bar Chart, you may want to look at Mike Bostock's Tutorial on d3
Because D3 using Javascript, it relies on callback function to call a draw function after all the data has been loaded.
var x = d3.scale.linear()
  .range([0, width]);
x.domain([0, d3.max(data, function(d) { return d.value; })]);
Here the we have assign x with scale object. the d3.max will choose max value from array based on "natural order". But because we have predefined the function, which takes x as an object and max of each of the data's "value", then d3.max will use the function to find max of "value".All of these code is what I copy paste from Mike Bostock's Tutorial, which the link I've given earlier. You should check the tutorial.
var bar = chart.selectAll("g")
  .data(data)
.enter().append("g")
  .attr("transform", function(d, i) { return "translate(0," + i * barHeight + ")"; });
While in this section, the chart select all g elements, attach given data to all "g" elements selected. Then enter each of the data in the array, if there's no corresponding data to "g", append "g". Finally alter the attribute by doing transform, provided manually the given function.And thus how we initialize the our bar chart.
bar.append("rect")
  .attr("width", function(d) { return x(d.value); })
  .attr("height", barHeight - 1);

bar.append("text")
  .attr("x", function(d) { return x(d.value) - 3; })
  .attr("y", barHeight / 2)
  .attr("dy", ".35em")
  .text(function(d) { return d.value; });
To alter the attribute, such as adding rect bar and text to all the data. These are the code that's been using.
REFERENCE :
- https://www.udacity.com/course/viewer#!/c-ud507
- http://bost.ocks.org/mike/bar/