A/B Testing Multiple Metrics
One thing could be changed when you do multiple metrics instead of single metric. There could be one metric that could occur significantly different by chance. That is if you choose 5% fixed significant level, there could be one metric that significant, but only one time. When you do some experiment in any other day, it shouldn't be reoccured. One thing that we could do is perform multiple comparison, see which of the metric behave differently.
We can use multiple comparison when for example we have automated alerting. See if suddenly metric that behave differently occurs. Or if we use automated framework in exploratory data analysis, you want to make sure that the metric is occurs and the different is repeatable.
Screenshot taken from Udacity, A/B Testing, Multiple Metrics Example
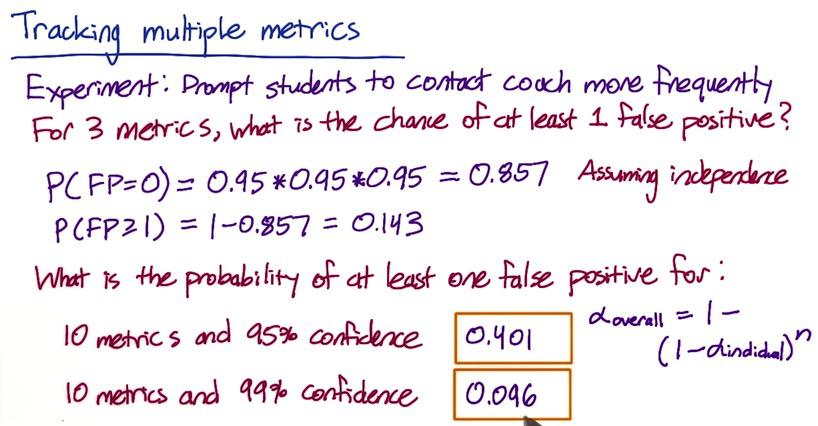
Suppose Audacity have 3 metrics for experiment when to prompt students for sign-up coaching.
These metrics could be:
- Time students sign-up early
- The progress of students already finished
- Average paid per students
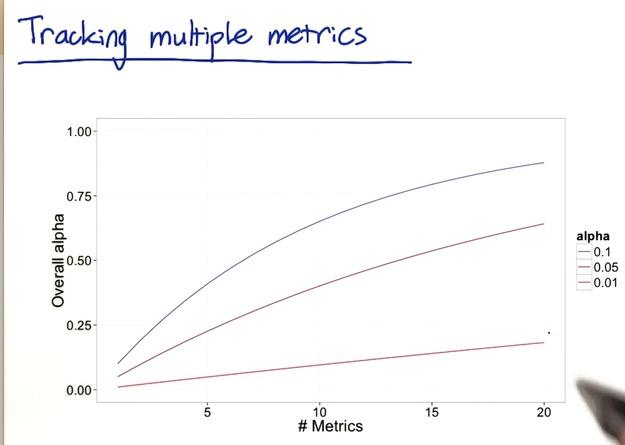
All of this metric has its own significant level, when it got multiplied the probability that could be occured by chance would stacked up. We could simulate each event with probability 0.95. And the probability of being none false positive would be 0.857 and at least one 0.143. Assume metrics are independent of each other, which in this case is not, because metrics that used for experiment probably dependent of each other. But let's make the assumption for the sake of intuition. Imagined the probability that at least 1 error is gone up to 14%. These could be increase even more as we increase number metric. With 10 metrics and same significance level, the probability gone up to 40%. With more stringent level at 1% of each metric, it will still up with 10 metrics by 9%. You can see the curve with number of metric increase in x-axis with y-axis where alpha(probability of false positive) increase with image below.
Screenshot taken from Udacity, A/B Testing, Multiple Metrics Example
Screenshot taken from Udacity, A/B Testing, Multiple Metrics Example
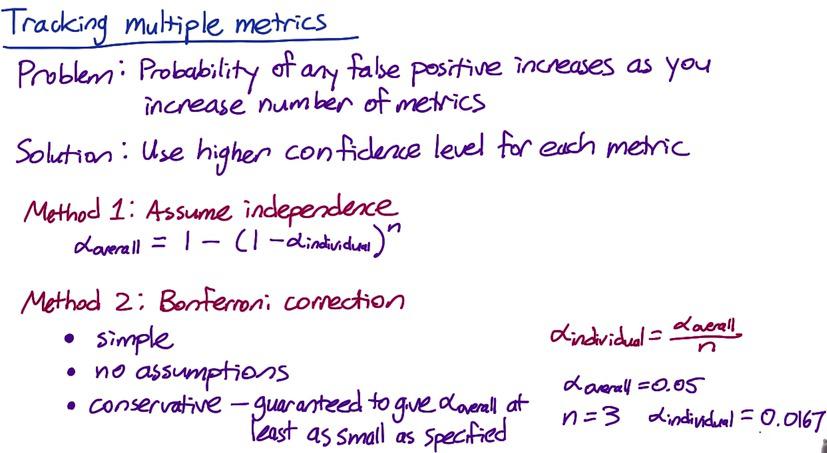
So how to tackle the probability of false positive that stacked up? There's two method that's been known. One is previously mentioned. The second method what other people (and me) usually use. It's called bonferroni correction. Bonferroni has two advantages, simple and no assumptions. Conservative could be double edge sword. It's conservative as it guaranteed to give you more stringent significance level for arbitrary number of metric, but it also conservative in a sense that it keep track for all metric. Over time the probability of false positive metric could be change, when bonferroni correction need all significance level must be fix for each metric. Bonferroni can't be used when your metrics as high correlation, it's characterize that it's too conservative will make it too strict to passed.
Bonferroni correction is also the subject of correcting in ANOVA, see my other blog if you're interested.
Screenshot taken from Udacity, A/B Testing, Multiple Metrics Example 2
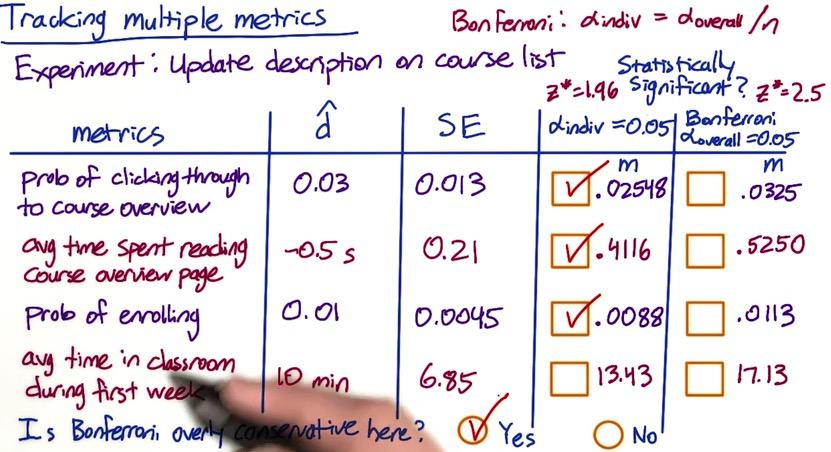
Let's take another example. Suppose Audacity want to test the changes that updates the description on course list. We want to see using individual alpha at 0.05, vs Bonferonnni corresponding alpha. Remember that the metrics we have is 4, so for individual alpha yield z-score of 1.96, Bonferroni approximate at 2.5
Next we want to multiply the standard error and the z-score, and let the difference with $\hat{d}$ as observed outcome. If the difference is lower than $\hat{d}$, then it's statistically significant. We can see that the other 3 has significant result while none of them pass bonferroni correction. Imagine that the experiment has yield success with most of the metric but fail because of the bonferroni correction. In this case, the correction is too conservative. When the experiments sucess, the probability of most of the metric would probably move altogether.
So what's decided then? Since Bonferroni correction is too conservative, you might want to use other more sophisticated method. But in practice, it's often you explain your results to the business strategy. They could launch/not launch the results if they afraid of the risk. Or if they have time, they could give you time to run more experiment.
There's different strategies that beside of Bonferroni correction.
- Control probability of any metric that shows false positive.we called $alpha_\mathbf{overall}$, when it's just family wise error rate (FWER)
- Control false discrovery rate (FDR)
FDR = E[#false positives/#rejections]
FDR means that if you have 200 metrics, and cap FDR at 0.05, it means you're okay with 5 false positives with 95 true positives in every experiment. In FWER, you scored 1, since at least 1 false positive every experiment.
Analyzing Multiple Metrics
When you do multiple metrics, you have the advantage that they are confirming each other. Supppose that you measuring experiment and you know you're success by looking metric like CTR and CTP moving in the same direction. But it could be that your experiment distract already good metrics. For example if you know your visitors take reading at your website for a while, it might be a good thing. But when you perform experiment hoping that clicks increase, it does, but in return people read less. So it's tricky to balance this out. it maybe 70:30, but it's difficult and sometime people prefer single metric for this reason.
There's metric like OAC that balance these metric. It doesn't move the metric from the opposite direction, but it's useful to see from ROI perspective. Like number of clicks increase each day without decreasing stay(reading) time.
To cope with this issue, you can plan your experiment from business analysis. For example you decide to choose 25% revenue vs 70% users increase, then you can start from there. You can plan your experiment, try whole bunch of parameters to balance this, see whether you're heading in a right direction. The downside perhaps is that you're more likely not blinded yourself. It could be that you make a bias in favor to your plan, and oversee lurking variables.
Google Fellow Diane Tang shares her experience doing OAC. After running a bunch of experiment, she and her team gather decision makers and ask them what the decision to launch based on solely the result of the experiment. She didn't tell them what is the business plan or even the experiment itself. In other words the decision makers are blinded. After they got their decision, then she and her team explain the experiment. If she and her team talking about the OAC early, the decision makers just ask what change the individual metric in the beginning. So it's not contribute much to launch decision. OEC just give you how to balance between stay time and click, something that you care about, but not launch decision.
Drawing Conclusions
After having significance test results, now we can do two things:
- Do we understand the changes?
- Do we want to launch the results?
There's a condition when you have multiple metrics, only one metric corresponds, but others don't. If it only small changes, you may want to proceed. But it's really an issue if you want to apply big changes. You want to understand the changes, see what's causing it (bug, data captured, filtering). There also a situation where your test is significantly different in one slice against another. Again you want to understand the changes. It could be that changes that you make, such as bolding the word, make actually emphasize the latin words, but not in japanese since it harder to read. So for that specific you want to apply different changes.
If you understand all the changes, you can launch the results, with answering three questions. Do you have practical significance and statistic significance result? You can justify your changes by comparing these two two test. What changes actually done in term of user experience? Is it worth it?
When drawing conclusions, all that matters is your recommendation based on your judgment. It's not really matter how you design/run experiment, the metric, or citation that you do. That's just a signpost to your end goal. They will only remember about whether you launch or not and whether it's the right recommendation.
Gotchas
It's a good practice to ramp up your size as you further move to launch experiment. You can start with 1% population and go until whole population. This is also better But what can be odd is that as you add larger sample size and more expriment. Your changes are flattened out.
Sometimes your significance test may not yield a significance different after experiment. This could be frustrating, as significance should always be repeatable. The reason lies with human behaviour that dynamic, always changing, in particular with seasonal effect. You can have summer season and students on vacation, suddenly everything change. And when they got back, everything change again.
To cope with this issue, you can use cohort analysis to limit for particular subset of users. Users that doesn't change its behaviour and still running consistenly accross experiment. By having those users, you can estimate users and error variability of other large proportion of users that do change. Or you can apply these subset of users to control group, and see how changes in experiment group over time.
There are other issue as well, as users could be change again if they already adapt to changes, and their behaviour could be unpredictable. To combat with the problem, along with cohort analysis, you can use pre and post period. This will make you understand estimate learning adapt of your users.
In summary when running A/B testing experiment, you have to check, really check about invariant and evaluation metrics. You have to do this first when running everything else. Second, think about the business metrics, because the changes also it's that the only one matter. Is it worth it that changes affect 30% users but neutral for others? Do you want to further experiment on it? What about if your experiment have positive impact on 70% but worse on 30%? You also want to know the after effort after your experiment launch, such as engineering effort, aftersales, maintenance. Does it worth the reward vs maintenance? And if this is your first time running big experiment, you want to try a bunch of other experiments, see what do you think before launch the changes.
Now we have cover all the basics from previous blog, from analyzing user experiments, understanding gotchas for single and multiple metrics, and what to balance from the business strategy. Again, it's important to directly jump into experiment and try it yourself.
Disclaimer:
This blog is originally created as an online personal notebook, and the materials are not mine. Take the material as is. If you like this blog and or you think any of the material is a bit misleading and want to learn more, please visit the original sources at reference link below.
References:
- Diane Tang and Carrie Grimes. Udacity