A/B Testing Metrics
When choosing a metric, there's a couple of thing that we need to know. It's the definition of the metris, build the intuition from it by performing sanity check and sensitivity test, and then characterize the metric by evaluation
Invariance metric vs Evaluation metric
There are two kind of metrics that measure how the experiment group is better than control. These are invariance metrics and evaluation merics.
Invariance metrics is performing some kind of sanity check for us before running the experiment, like checking whether the distribution is the same. It performing some consistent checking across all of our experiments, which is why it shouldn't be changed. Otherwise we have to start it all over again. Some changed because we want to increase number of users involved.
Evaluation metrics, is usually the business metris, like for example market share, number of users, or user experience metrics. Sometime it measure what previously stated as taking long time because it doesn't contain enough information, like measure user that got a job after taking MOOC. This is a difficult metrics which require special technique, as discussed in next blog.
First you want to create a metric that everybody undestand, like number of active users. Then you translate this high level concept to down to more technical level. What's active? Is it last 7 days? last 30 days? After that you want to create summary metrics, usually in form of statistics. Like count (number of users fit for this) , ratio, difference, mean or median. Some of this statistics is tricky, which will be discussed in next blog.
Typically for sanity checking we have multiple metrics that each represent sanity check. Then for evaluation, you can choose one summary metric for single objective, or you want to perfom some combined multiple metrics, often called a composite metric. While one metric is straightforward, composite metric is harder to maintained.
Composite metrics have different weighted function for different metric. This has to be aggreed, even understand by all users. It can be potentially understandable and desirable for some users, which want to make it more weighted. When there's radical change to the metric, it will also change different weight which will be asked by users. Then you have to explain it again and observing all other things all over again.
One generally applicable metrics across experiments is a good idea. If you have custom metrics for each experiment, it potentially add more bias hence more risk.
Overall,when discussing a metric, it's often necessity to do some sanity check. Latency in in search result case, may be used in the beginning in evaluation whether we must display 10 or top 20 in one page. But turns out latency is used as invariance metric to do some sanity check.
High level concept
Suppose from Audacity example earlier, it has two high level concept metrics. Get students more financial sustainability and get them jobs. Then from earlier funnel we will expand it, creating more metrics which means more funnel
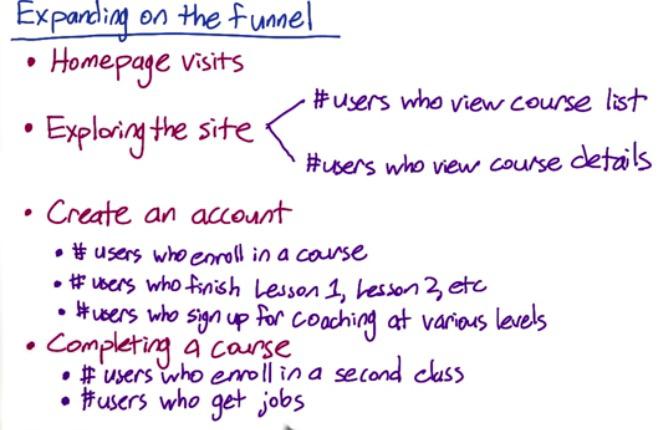
Screenshot taken from Udacity, 1:06
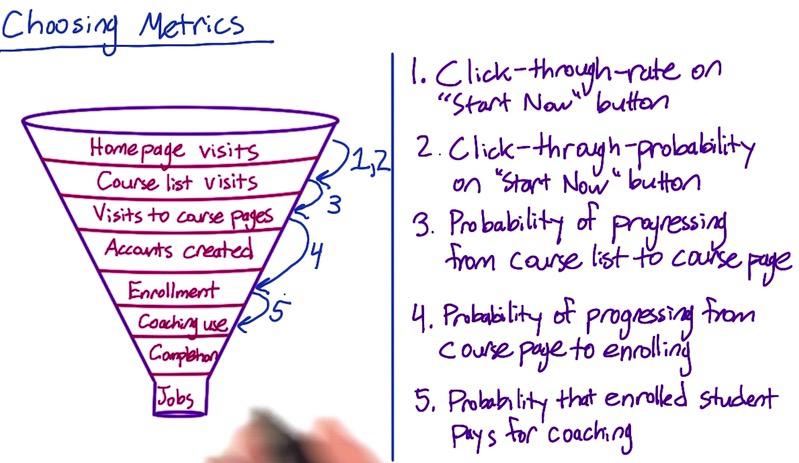
Screenshot taken from Udacity, Choosing Metrics
- Update a description on the course list page -- 3
- Increase size of "Start Now" button -- 1
- Explain benefits of paid service -- 5
Since we discussed earlier that multiple metrics can be chosen, for points above, for example we want to choose from 5 metrics, which are the best served above critea. Track the probability, when misleading description may caused huge decrease when students realize it's not fit for them. Click through rate is used to test viewability of a button. Also benefit user retention, how user want to pay another coaching. Or usage, if students know coaching method, would they want to it?
There are other worth mentioned in our choosing for validating metrics to lower level.
Often time took in choosing and defining metrics is very long compared to running the experiment and validating the results. CTR is one clear example. While CTR formula is very simple (nclicks/nimpression). It turns out technically different (is it impression? page views? page load?). Once product metric thrown, we have to agree on the basis in data science metrics. So agreeing definition at all levels has to be finished. Without this many things can go wrong.
Another example is in sensitivity and robustness. We know that latency is pretty lumpy. Using mean will make our summary metrics pretty different, because there is two group, smaller and greater internet access. Variability between groups can be based on different browser, different OS,device, or another thing that may harder to access them. If we use percentile, does it benefit more to one group compared to another? We will be talking about variability, sensitivity and robustness in the next blog.
Defining the metrics, business often loves 30 days as a metric. While in the engineering, weekly basis on 28 days are good idea.
It's good idea to build intituion by trying it yourself to see which gone wrong. You have to see for yourself in practice. Search engine back in the days only contain some information. But nowadays as search engine become more complex, people change the way it search by only navigation (address) or performing complex queries. So metrics sometime can be useful in particular time, but then stop and not working, because the use case of clients to our product is evolve. Understand everything, from metrics, data, or talking to engineering team to know how data is captured.
Disclaimer:
This blog is originally created as an online personal notebook, and the materials are not mine. Take the material as is. If you like this blog and or you think any of the material is a bit misleading and want to learn more, please visit the original sources at reference link below.
References:
- Diane Tang and Carrie Grimes. Udacity