Decision Hypothesis Testing and Confidence Interval
Decision Errors
Sometimes in you have decision case where error like innocent people go to jail, or bad people not guilty.You have to balancing this error. Decision Errors is like precision and recall. You have type 1 error and type 2 error that this is inversely proportional. You have to make a judgement based on this decision.
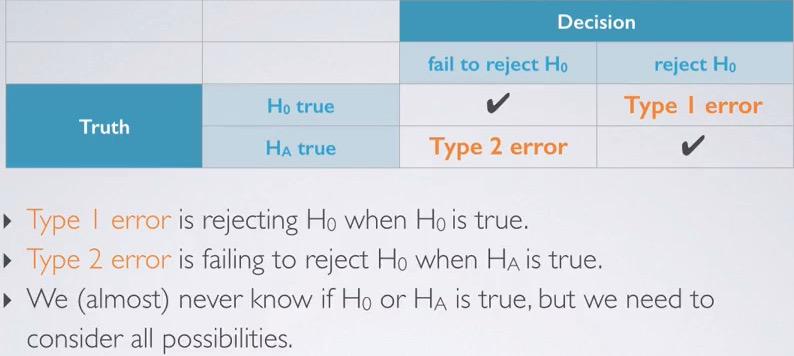
Snapshot taken from Coursera 02:09
We are in safe condition if we fail or succeed reject H0. But what if the other hand, When type 1, rejecting H0 eventhough H0 is true, or type 2 error rejecting H0 when HA is true? Just remember that you have to focused on the truth value to decide type 1 or type 2 error. If the truth value actually H0 is type 1 error, otherwise if you have truth value equal HA, you choose type 2 error.
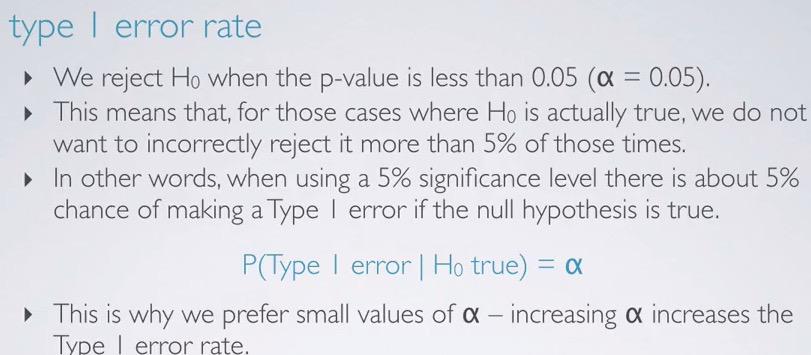
Snapshot taken from Coursera 05:27
In this example, type 1 error rate focus on the H0, we reject null hypothesis eventhough it's true. Less than 5% we reject it. More than 5% we keep H0. If we increase it, then it would make a bigger chance to reject the H0, thus increasing type 1 error rate, but decreasing type 2 error.
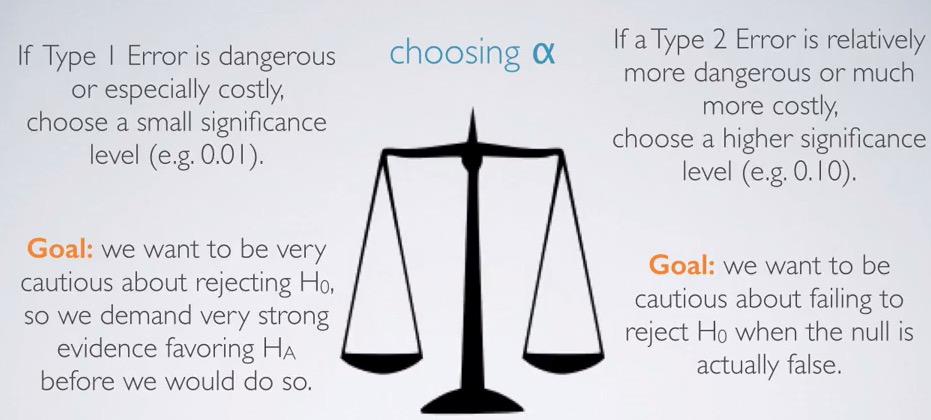
Snapshot taken from Coursera 06:17
So essentially it down to what your goal is. If you think that rejecting H0 is very expensive, you choose smaller significance level. But if you think that fail to reject H0 is very expensive, you choose higher smaller significance level.
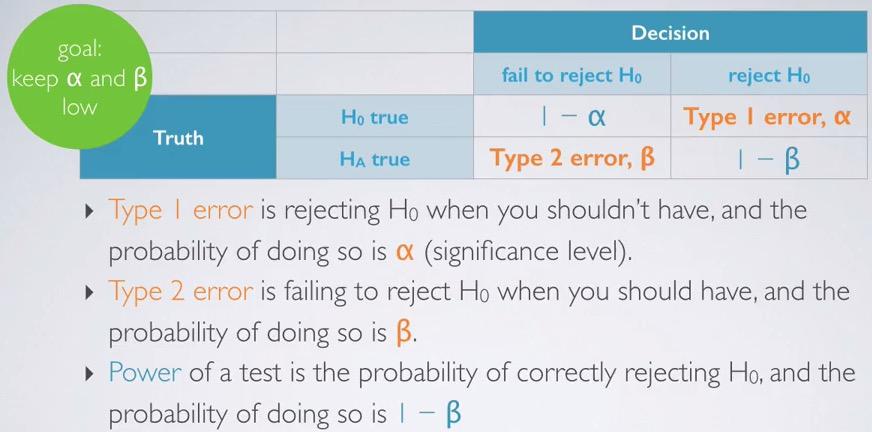
Snapshot taken from Coursera 07:34
So Type 1 error is represent $\alpha$. The power is the compliment probability of each $\alpha$ and $\beta$. The goal is to keep $\alpha$ and $\beta$ low.
Snapshot taken from Coursera 08:28
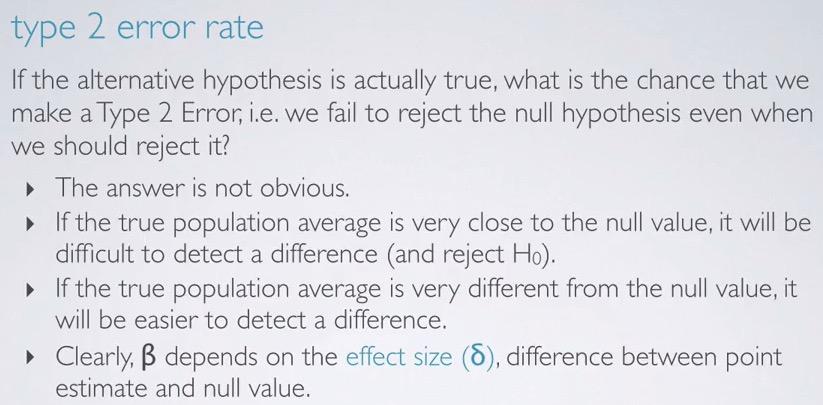
Type 2 error is talking about fail to reject the H0, even when we should reject it. If the difference HA provide very close to the null value, we may fail to reject it. But if the different is large, we can reject the null hypothesis. The difference is the effect size which type 2 error depends on.
Significance vs. confidence level
Often two of our inference method, Hypothesis Testing and Confidence Interval have interplays. It's because both share common ideas. Significance in hypothesis testing can be play nicely with confidence interval.Sometimes you see significance level of 5%, and confidence interval of 95%. It's not coincidence that both are actually compliment of each other. Some specific in two-tailed test may applied.
Two-tailed hypothesis test
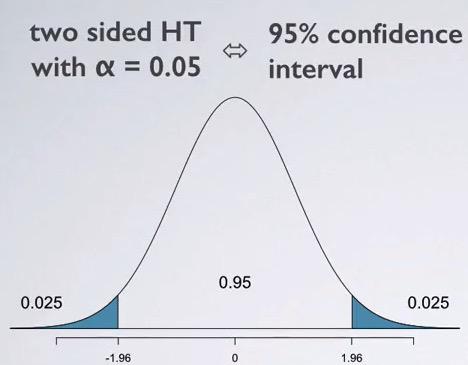
Snapshot taken from Coursera 01:58
When you have two-sided hypothesis test, you have significance level of 5% that's equivalent to 95% confidence level. This happen when we split the significant and shade the area exclusive of each of the side. Then the middle not-shaded area is our confidence interval. the two-sided hypothesis test and confidence interval will be add up to 1.Now what about one-sided hypothesis test?
One-tailed hypothesis test
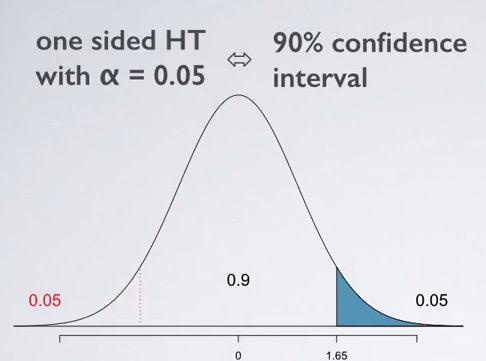
Snapshot taken from Coursera 04:33
Different to what we know from two-sided, the significance may not actually complement from each other. Suppose that we have one sided HT with significance level of 5%. That means we only consider one of two side(no matter which side, it applies the same).That means we have to also consider the other tail, eventhough we're not interested for the other side. Why? Remember that confidence interval is always symmetric. So, when you cut off and shade the area of 2.5%, you must also consider the area below 2.5%. That's why it often useful to draw the distribution, and shade the area you're interested in. So, one sided 5% will always be complement to 90% of confidence interval. Since we're indirectly have to consider 5% for the other side.Since this two method is complement of each other, we have advantage of validating our solution with one another. For example, if you use HT to solve the problem, the problem should be equal complement to if we use confidence interval.
Snapshot taken from Coursera 06:03
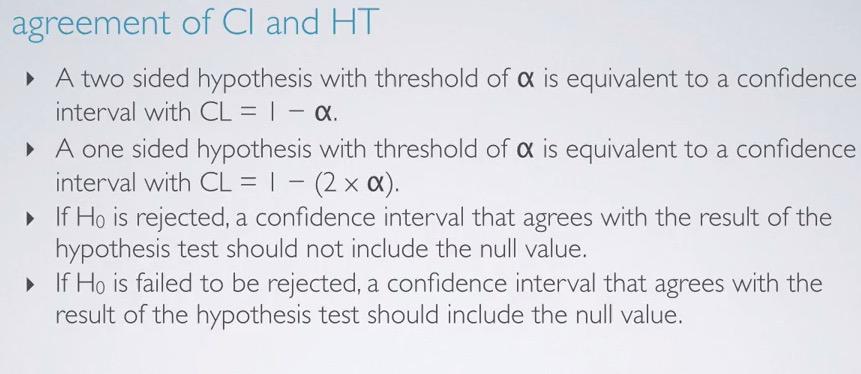
So in summary:
- if you have two tailed test, then confidence interval is directly complement it.
- if you have one tailed test, then you multiply by 2, and CI will complement it.
- if you're doing Hypothesis Test and you reject the NUll Hypothesis, then you can validate by using CI, that the null value should not be in the interval.
- Otherwise, if you fail to reject the null hypothesis, then CI should include null value in the interval.
Snapshot taken from Coursera 06:03
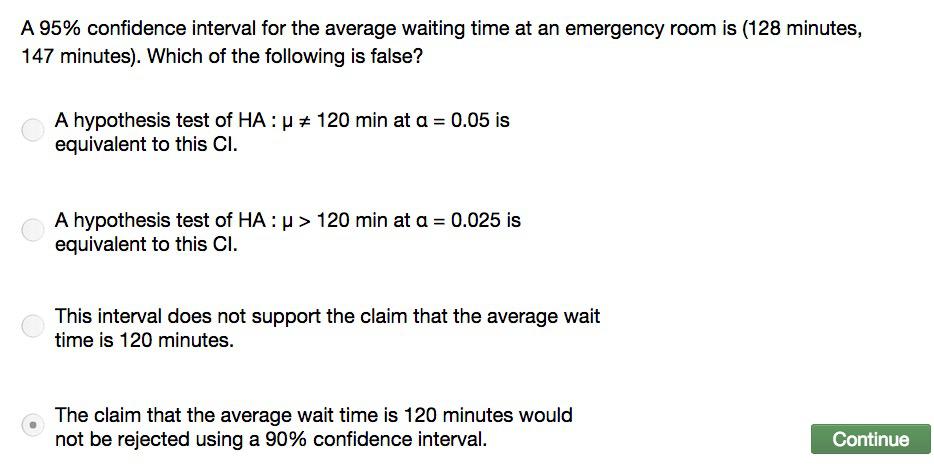
- $\neq$ means can be more or less. So it's two sided HT, and it's correct.
- $>$ is one sided test. and that is also correct.
- Yes, Because 120 minutes is not in the interval, the data doesn't support evidence to reject. The null value is 120.
- No, decreasing the confidence level will only shrink the interval, and it becomes more impossible to include 120.
Statistical vs. practical significance
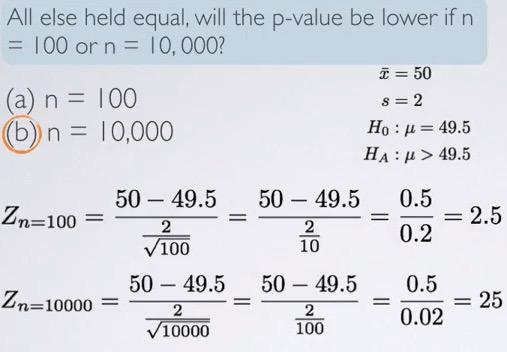
So far we have seen in many cases earlier, statistical significance is the same with practical significance. We can calculate those statistically, and to observe significance population parameter. Let's answer simple question, would the p-value lower if we increase the sample size (All held equal). Of course! this will directly affected the standard error, which the smaller the SE in the denominator when calculating the Z-score, the higher the Z-score. This results in the higher the z-score, the more far the Z-score the from the center of the distribution, resulting the smaller the p-value.
Snapshot taken from Coursera 04:17
In this example, suppose that we have made up everything and calculate the Z-score. You can calculate this based on
$$ Zn = \frac{\mu - \bar{x}}{\frac{s}{\sqrt{n}}}$$
where n is the sample size. Now the calculation as you can see for different sample size is basically the same. Except that you change the sample size(of course!). This will result in 2.5 vs 25 standard deviation away. 2.5 is large, we can see that it falls between 95%-99.7%. But 25 Z-score is practically huge, and drop the p-value to almost zero.
Snapshot taken from Coursera 07:07
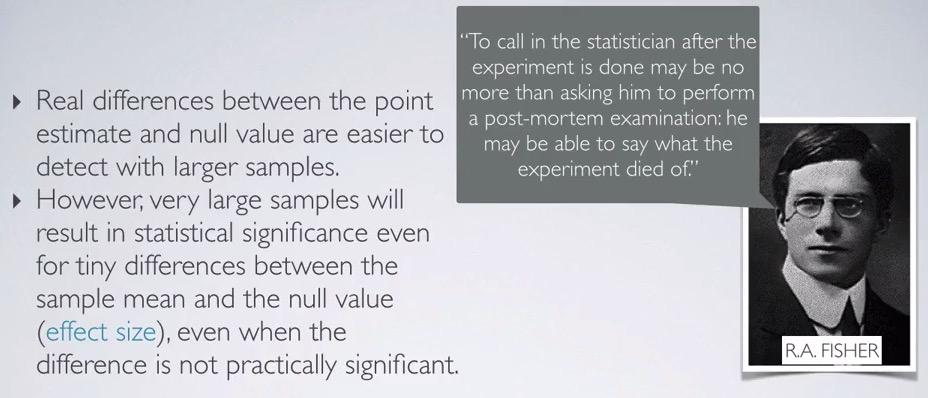
So if our p-value is practically zero? What does it result to? So when you have large enough sample, you can say that statistical significance is very much the same with practical significance. But when you gather very large sample, statistical signifance will result in tiny different but not practically significant. In your research, you often need to provide the effect size, so the readers can compare the result between statistical significance and the practical significance.
Ones may be careful about balancing these. Often researchers consult to statistician to determine the number of observation/sample that they require. Because if you have gather lots of sample(using more resources of course!), it's not useful if it's not practically significance. In other words, if we can gather sample size enough to achieve p-value almost zero, but not too much as it's useless.
REFERENCES: