Difficult Metrics in A/B Testing
Sometimes when performing A/B testing, you faced with a difficult metrics. Audacity MOOC example, has trouble to find whether the students successfully landed a job. This blog discuss how to deal with difficult metrics. It's not it's impossible, but we can vary our validation technique to create such that.

Screenshot taken from Udacity, A/B Testing, Difficult Metrics
Difficult metrics arise when we don't have access to the data, or taking too long to get. In the case for Audacity, students who get jobs after course completion is hard to measure. We don't know whether the students receive it, and if we do have that, it will be taking too long to measure.
Another example, is when #1. We may have data, but it will taking too long. The formula to calculate this is to number of students completion at 2nd course, divided by students with 1st course completion. Same thing goes with average happiness with Amazon shoppers. Or if people successfully find an information they need in Google. All of these conditions don't have any data.
To cope with this issues, there are many techniques that we can use. Among them are:
- External data
- UER
- Focus Group
- Survey
- Retrospective Analysis
- Experiments
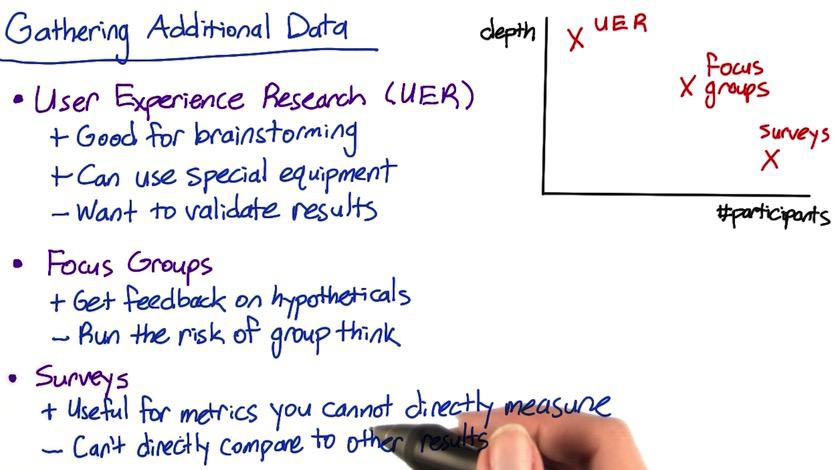
Screenshot taken from Udacity, A/B Testing, Difficult Metrics
To use metrics that we can't find in any of our existing data, we can use UER, focus groups and survey. These techniques can be measured by quantitative (number of participants) and qualitative(depth knowledge of the users)
UER really does a great depth about each participants. It used primaly for brainstorming to change test, or identify possible metrics. UER can measures the click of users, how they interact the website(how they can hover over the mouse), and if by taking additional camera, how their eye movement move through our website. Of course, we want to validate the results, eye movement may not actually users looking through our website. We can validate it by doing retrospective analysis.
Focus groups is when you ask a bunch of people to participate by coming in face to face. You ask them directly or it could be in a form. It's good because you can ask feedback from them, but it's risky. Because like any other focus group, there are always voice that so dominant it overshadow everyone else.
You could ask for a feedback in a survey, either by face-to-face interview, form, of phone call. Survey got you more people than focus groups and UER, but it also potentially has more bias. Phone call for example, some of them don't want to give sensitive information, like how long they got a job after they finish their MOOC. People sometimes lying when receiving questions which discomfort them. Or if we could do it by form, there's could be bias that the only ones filling the form is the ones that have strong opinion on the issue, and it rarely neutral. The other bias is the ability to call students that finish their MOOC. Like the number students called is significantly lower than total number of students. So we suffer population bias.
External data is when you decide to use 3rd party data, data that isn't gather by your own company. Some company has extensive research in form of granular data. Nielsen for example, provide market share about us and our competitior. And not just market share, maybe people interest, or visitors to a website. External data can be also be used to validate metrics.
Retrospective Analysis uses your historical data. Suppose want to see how long is the interaction of your users to the websites. Retrospective analysis using log data, mouse hover, click coordinate that already been recorded in your existing database. This is usually combining multiple sources. Although this analysis can be used in conjunction with survey and UER, it only draws correlation. For causation, you might want to try experiments.
We run experiments when we want to draw causation rather than correlation. We exclude any lurking varible, random assign participants to each of the group, and use blinding to avoid any bias. in A/B testing for MOOC website, it can test out variety of quiz, sensitivity and robustness. We can also find other people that run experiment through published paper. They also run their experiment group, like how understanding the material in correlation of how many time spent on the page. It also good for brainstorming idea and a good validation metrics/techniques.
There are many other techniques that can be used to combat difficult metrics. There is human evaluation, which for every changes that we make, we ask people for a feedback. You may want to ask your colleague about their experience when handling difficult metrics in their previous company. It could give you some intuition
It's robust to use multiple metrics. Happiness for example, how to measure it? We want to check the log, how long they spend in our website. Then try to trigger other metrics by survey, focused group, asking questions like are you considering 2nd course? are you happy with the 1st course? Measure their happiness. Layout boundary of your metrics, you won't get same result across metrics, but it give some sense on what's missing and what the right thing to measure.
Disclaimer:
This blog is originally created as an online personal notebook, and the materials are not mine. Take the material as is. If you like this blog and or you think any of the material is a bit misleading and want to learn more, please visit the original sources at reference link below.
References:
- Diane Tang and Carrie Grimes. Udacity