Visualization for Multi-Dimensional Data
If you want to take visualization for more than 3D, it's best to use retinal variables like shapes and colors. But you know that multi-dimensional data isn't just 3D, or 4D. It could be thousands or hundreds of thousands of columns in your data. All of these data have different characteristic. It's important to know that you want your data in the same page, in the same direction, same data type. This way when you're trying to visualize it, you expect to see pattern. Try to manipulate the data so they're in the same group, but not biased. You might also want to check the scales, see if all the data is in the same tuned. Data that are the same page called Homogeneity, otherwise called Heterogeneity.

Homogenous data can be benefit using Heat Map. Heat Map is the type of chart where you assign each item value as a pixel. In doing this you can map big data. But Heat Maps without first clustering your data will be just noise in the picture. So you may want to do some cluster first. If there's condition where your data is growing, there won't be enough pixel to take care of it. Instead, based on similarity, you can map three data values into one pixel.
Suppose you do have heterogenous data. Your data is on the different category, or different concept. You can facet your chart into small multiples and have a really different chart. If the data is really different, you can insert different legends, otherwise if it just categorical, then you can just put one legends.

You can use use Parallel Coordinates(PC) to chart your data. The idea is columns will be axis that is can form multiple vertical line. And each row will be horizontal line plot to every columns vertical line, depending on the value.
There is some limitations that PC has. We can only observe some adjacent between lines. There's overplotting that may occur, of course there some ways to handle this, like sampling or jitter the line. You can also represent all lines that perform same regression line to just one.
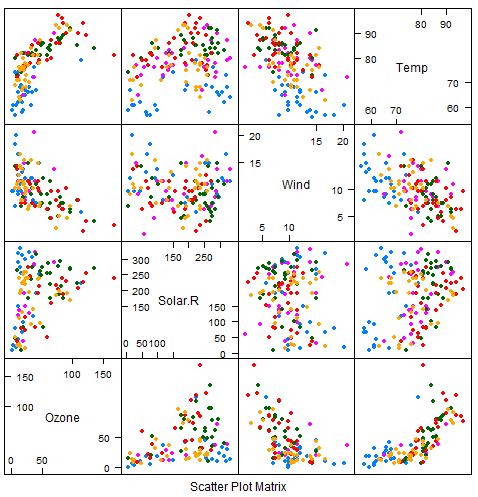
The next thing is Scatterplot Matrix. SPLOM let you plot your data each column against another. This could mean n^2 of chart with n columns. There's however unnecessary plot that you have if column meet its column. To cope away with this, people usually replacing the chart with same columns with histogram.
So for multi-dimension data, you can choose which type do you prefer. Whether is simple complex visualization, or multi simple visualization.
World Map Chart
There are also the case where you make a world map value, show every value for every region. This could means that 3D world sphere make a projection to your 2D canvas. This is going to impact your value as some of coordinat in map will get distorted. In Mercator 3D world mapping for example, all the region get preserved, except north pole and south pole.

One of the best way to visualize on the map is by choroplet and isorithmic. With choropleth, if you have two distinct category for example, you can color the region depending of that particular attribute. This could often a bit misleading, as number of people is not uniformly distributed for each region. So even in most region colored one sided, the other side could still show significant by people in it. The best way to handle this is by making buble size across regions, and color the bubble depending on the category

Isarithmic on the other hand is how you perform continous color across the map. It doesn't cluster color based on the region like the choropleth, the isarithmic independent of the region and perform the distribution of the value. The boundaries of course still drawn to let users know what particular country they can look up to.

The other possible chart in map are cartogram. Cartogram let you distort the area of the map according to the value. For example region that have higher people could have larger size than others. The distortion can misled the readers, but it's not the case as people know exactly the location of the countries in the map.
There are also Flow Maps that famous by MInard of mapping Napoleaon Invasion. You can look into it and discover the flow of the data by size and the direction. You can check out this article.
You may have some work that include text, and want to perform some visualization just based on text. There are also Tags Cloud, that let you visualize the frequency of the words by their font size. The one that most frequent gets larget font size than others.
Of course there are some other software tools that let you make a graphic visualization without all coding. There are Tableau, one of the company that becomes really big in recent years because it only need your data and tweaking. You can get the chart, and the people that reference your chart will also get update if you update it. There are also D3.JS some Javascript library that can make data interaction and animation about your chart, it's really famous nowadays.
RESOUCES: