A/B Testing Sanity Check
In this blog series, we're going to talk about analzying our results, what we interpret from the results of the experiment, what we can and can't conclude. We will use invariant metric for sanity check, as we will be discuss in this blog. Evaluate in single metric and multiple metric, also gotchas in analysis.
Sanity Check
After we're getting the results of the experiment, we can't directly interpret the results. We have to do sanity checks. It can be many things. The results is comparable for both experiment and control groups. You want to make sure that the filtering is the same for both. The data captured is the same across experiments. Counting clicks example proves that there's multiple condition that we want to sanity check. We also have to check for the invariance metric.
There are two things in invariance metric. First, we talked about earlier, how we can use unit of diversion and population to determine comparable results for both experiment and control. The second is the invariant metrics. It didn't change in the beginning of the experiment, and it still shoudn't change after the experiment.
After you have running all sanity checking including invariance metric, it only then you can do complex analysis based on the results of your experiment.
Choosing Invariant Metrics
Screenshot taken from Udacity, A/B Testing, Choosing Invariant
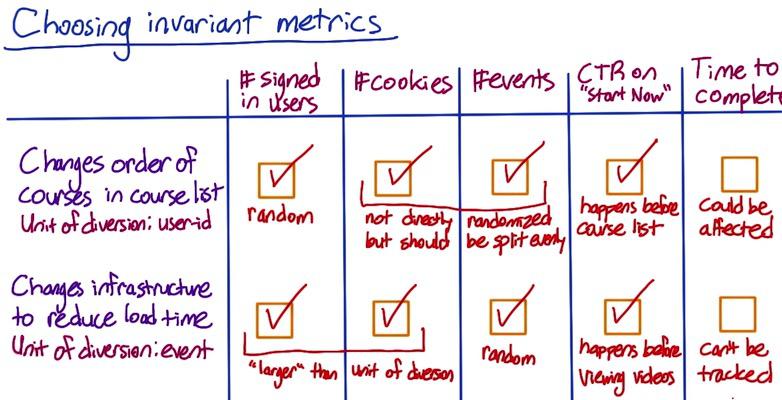
Beside the population sizing as invariant metric, there's also could be other thing to pick depending on your case. Suppose Audacity running two experiment, changing order course list, and changing infrastructure to reduce the load time. And they choosing which the metric that can pick as invariant.
The first experiment using unit of diversion of user-id, thus #signed-in users should make random assignment for both experiment and control groups, these number should be comparable. Cookies and events are not directly randomized, but since cookie correlated with users it should be randomized as well. We also know that one user is generate multiple events, so events is also correlated by users. So we can choose cookie as well. CTR on "Start Now" button also make a good invariant metric, since it happens before the experiment, it should be comparable in both groups after the experiment. Time completion could be different though, if course list sorted in easy to hard, time completion of each students could be different.
The second experiment using events as unit of diversion, so we can be assured that #events should be randomly assigned. And as previously stated where events caused by users, cookie and user-d can be chosen, eventhough it's larget than unit of diversion. CTR on "Start Now" also can be picked since it happen before the experiment. Reducing load time could be affect time completion, students that load faster video could end up faster completion.
Screenshot taken from Udacity, A/B Testing, Choosing Invariant, Part 2
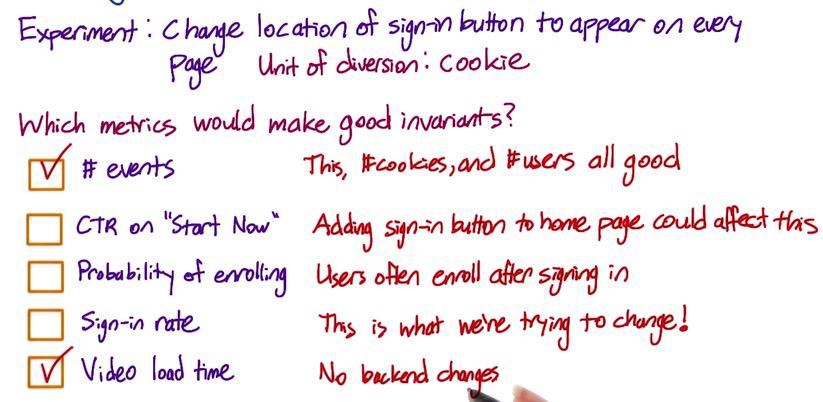
Let's take another experiment. Suppose Audacity experiment changes for sign-in button in every page, rather than just in a course list. The number of events, like cookies and users as previous mentioned will always made as a good invariant, since the unit of diversion is cookie. Video load time is irrelevance to the sign-in, so it will be good invariant metrics. CTR can be affected by the experiment. So since students will click start now button after sign in. That's also applied to probability of enrolling. Sign-in rate is definitely not a good invariance metric, since it's a metric that we're trying to change.
Checking Invariants
Screenshot taken from Udacity, A/B Testing, Checking Invariant
To check the invariants using number of cookies we can follow these steps below:
- Create one summary metric (#users within 1 week) for both control and experiment groups.
- Compute standard deviation with probability 0.5. Since success and failure proportion should be equal.
- Multiply z-score to get the margin of error.
- Check whether the observed fraction is within the interval
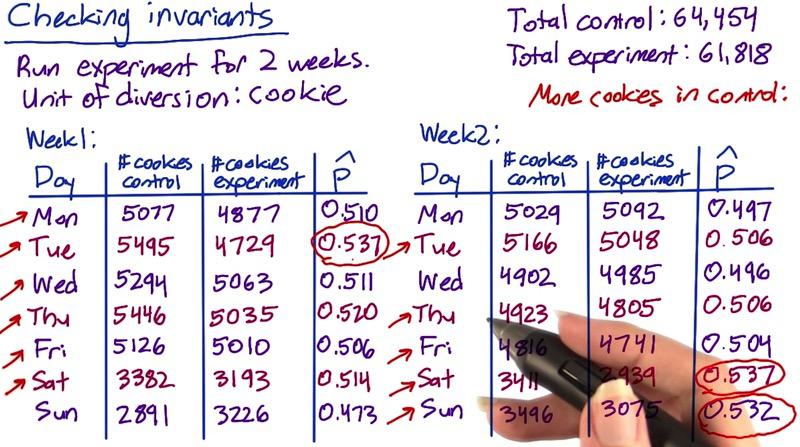
Fair experiment should gives you equal proportion between number of cookies in control and experiment groups, since we also using it as unit of diversion. In that case we're using 0.5 proportion as our point estimate. Since number of sucesses and failures at least 5 for each day, the standardized distribution should be in normal distribution.
So we can use our usual 95% CI to get z-score, 1.96. Then, we check whether the observed outcome $\hat{p}$ is within the interval. If it doesn't, then the number of cookies is significantly different.
Computing standard deviation, we get:
sd = $\sqrt{ \frac{0.5*0.5}{64454+61818}} = 0.0014$
Calculating the margin of error:
m = sd * 1.96 = 0.0027
CI = (0.4973,0.5027)
Pool proportion, our observed outcome:
$ \hat{p} = \frac{64454}{64454+61818} = 0.5104 $
Since our observed outcome yield 0.5104 and it is significantly different (higher than 0.5027), this would means our experiment doesn't pass the invariant metrics, which means something wrong with our experiment.
It's a good idea to talk about engineers about this problem, and slice and find based on language, platform, time, to find which makes this error. If we look at the picture above where we have two weeks experiment, there's number of cookies that's significantly higher than the rest. Or you could check age of cookies, perhaps there's one group that has old vs new cookies.
Screenshot taken from Udacity, A/B Testing, Checking Invariant, Part 2
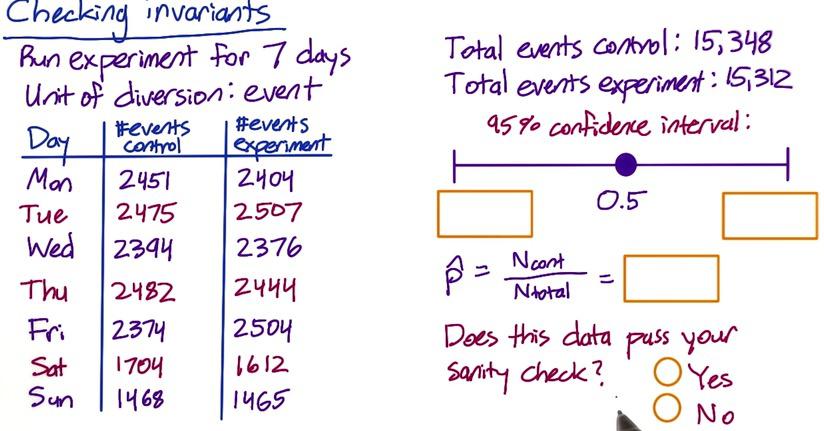
Now let's change this to 7-day experiment using event as unit of diversion. If we calculate this,
import numpy as np
true_p = 0.5
t_cont = 15348
t_exp = 15312
sd = np.sqrt((0.5*0.5)/(t_cont+t_exp))
m = sd*1.96
CI = (true_p-m,true_p+m)
print CI
pool_p = float(t_cont)/(t_exp+t_cont)
pool_p
Since our pool proportion is still within the interval, this does pass sanity check. Then we don't have to worry about checking further number of cookies by day data.
In summary, if you don't pass the sanity check, you should not continue to analyse your experiment. Commonly there's three things that you could do. First one is in the technical level. You should take to your engineers what went wrong, atribute that is really different in invariant metrics. Secondly, you could do retrospective analysis in your data, see if you can debug through slicing by features that we have talked earlier. Finally you could check the metric by pre-period and experiment period that's been discussed in previous blog. If you see changes in both period, then it maybe backends/infrastructure failure. If you see changes in experiment, then it could means there's something wrong in your experiment.
There's many thing that you can investigate when something is wrong between experiment and control groups. You could have different data capture between both groups, or you could have different filtering. Or users have reset their cookies, so you can check all of these things.
Learning effect could be attribute to changes in both your experiment and control groups. But it something that evolve in time, when user adapting to change. If you see sudden change, then learning effect may not at fault.
If all of the invariant metric has passed, then you can finally analyse the experiment.
Disclaimer:
This blog is originally created as an online personal notebook, and the materials are not mine. Take the material as is. If you like this blog and or you think any of the material is a bit misleading and want to learn more, please visit the original sources at reference link below.
References:
- Diane Tang and Carrie Grimes. Udacity