Size of Experiment
There's many things to take into account when choosing which size for your experiment. Practical significance level, statistical significance level, sensitivity, metric, cohort, population will result in different variability.
Variability and the duration of your metric. Suppose you want to run an experiment that will affect global user. Running experiment worldwide is time consuming since you observe a lot of users. What you want to do is take subset of population, doing cohort for example. Choosing this will give you much smaller size and different variability. But it will give you some intuituion whether your experiment is actually have an effect.
Suppose you know that from video latency example in previous blog, what you're really want is people with 90th percentile, that is people with slower internet connection. And because you want to have immediate feedback, you cohort based on users that last activity seen in 2 month. This experiment could give you decision whether you want to continue for worldwide experiment.
So how variability affects sizing? Suppose Udacity includes promotions for coaching next to videos side, experimenting wording usage with CTR metric and pageviews as unit of analysis as well as unit of diversion. Let's take cookie for example for comparison in the unit of diversion. When choosing analytic, analytic probably underestimate cookie diversion. Suppose you're sampling 5000 pageviews, and indeed empiric standard deviation gives 0.00515 for pageviews and 0.0119 for cookie.
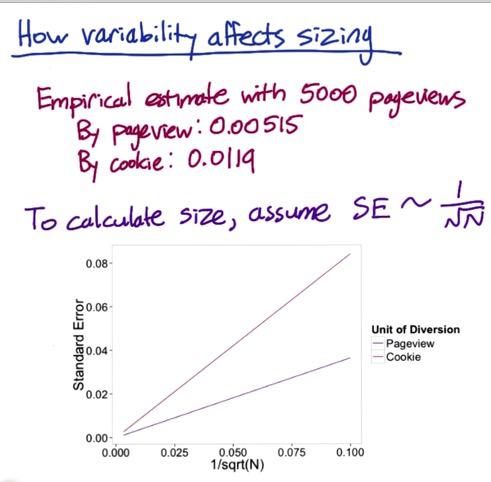
Screenshot taken from Udacity, A/B Testing, Sizing Example
We're using analytical standard error on the x-axis, the standard error for cookie is higher than pageview. Suppose we want observed difference minimum at 0.02 then by analytic we should have sample size 2600, and 13900 by cookie. That's a lot for getting the sample and will affect your investment in the experience. This is just by analytical, we can try to actually use this calculation to observe the real mininum difference. This is good when you practice to get some intuition.
Decrease Experiment Size
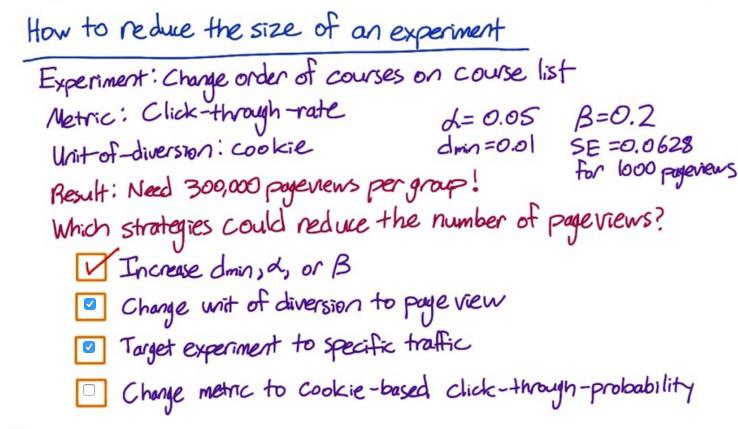
Screenshot taken from Udacity, A/B Testing, How to Decrease Experiment Size Example
In the previous blog, we found that increase practical significance boundary, increase significance level, and reduce sensitivity, will reduce the nuber of pageview.
When we change unit of diversion to page view, the sample required will be reduced, since it will be the same as the unit of analysis. But using pageview instead of cookie, will means that it's less consistent experience, so you have to decide. SE will be reduce to 0.0204, required only 34000 pageviews for each group.
As we also learn in previous blog, subsetting population, for example to Indonesian only, will change variability of your metric, hence impact the choice of practical significance boundary either go up or go down. SE changes to 0.018, and even if we set dmin to 0.015, it require 12000 pageviews per group.
Change the metric to CTP often doesn't make significance difference, if exists, the variability would go down, but not much.
The calculation for these is in R code below.
%load_ext rpy2.ipython
%%R
# Udacity, A/B testing, How to Decrease Experiment Size, Download section
# %load empirical_sizing.R
## Strategy: For a bunch of Ns, compute the z_star by achieving desired alpha, then
## compute what beta would be for that N using the acquired z_star.
## Pick the smallest N at which beta crosses the desired value

# Inputs:
#   The desired alpha for a two-tailed test
# Returns: The z-critical value
get_z_star = function(alpha) {
    return(-qnorm(alpha / 2))
}

# Inputs:
#   z-star: The z-critical value
#   s: The variance of the metric at N=1
#   d_min: The practical significance level
#   N: The sample size of each group of the experiment
# Returns: The beta value of the two-tailed test
get_beta = function(z_star, s, d_min, N) {
    SE = s /  sqrt(N)
    return(pnorm(z_star * SE, mean=d_min, sd=SE))
}

# Inputs:
#   s: The variance of the metric with N=1 in each group
#   d_min: The practical significance level
#   Ns: The sample sizes to try
#   alpha: The desired alpha level of the test
#   beta: The desired beta level of the test
# Returns: The smallest N out of the given Ns that will achieve the desired
#          beta. There should be at least N samples in each group of the experiment.
#          If none of the given Ns will work, returns -1. N is the number of
#          samples in each group.

required_size = function(s, d_min, Ns=1:20000, alpha=0.05, beta=0.2) {
    for (N in Ns) {
        if (get_beta(get_z_star(alpha), s, d_min, N) <= beta) {
            return(N)
        }
    }

    return(-1)
}

# Example analytic usage
# This is the example from Lesson 1, for which the online calculate gave 3,623
# samples in each group

# s is the pooled standard error for N=1 in each group,
# which is sqrt(p*(1-p)*(1/1 + 1/1))
required_size(s=sqrt(0.1*0.9*2), d_min=0.02)

# Sizing: Example
# Cookie-based diversion
# Since the standard error is proportional to 1/sqrt(N), s, or
# the standard error for N=1, is equal to the mesaured standard error with 5000
# in each group times sqrt(5000)
required_size(s=0.00515*sqrt(5000), d_min=0.02)
# User-id-based diversion
required_size(s=0.0119*sqrt(5000), d_min=0.02)

# Sizing: Quiz
# Original size
required_size(s=0.0628*sqrt(1000), d_min=0.01, Ns=seq(10, 500000, 100))
# Size with event-based diversion
required_size(s=0.0209*sqrt(1000), d_min=0.01, Ns=seq(10, 500000, 100))
# Size with event-based diversion and English-only traffic
required_size(s=0.0188*sqrt(1000), d_min=0.015)
# Size with cookie-based diversion, English-only traffic, and
# click-through-probability instead of click-through-rate
required_size(s=0.0445*sqrt(1000), d_min=0.015, Ns=seq(10, 500000, 100))
%R required_size(s=0.0119*sqrt(5000), d_min=0.02)
Sizing Triggering
When you want to know which size from the side of your decision, you want to turn first to global users experiment, see which area is affected by your experiment. For example you could lock for 1 day, or 1 week only to get some intuition about sizing the experiment.
Disclaimer:
This blog is originally created as an online personal notebook, and the materials are not mine. Take the material as is. If you like this blog and or you think any of the material is a bit misleading and want to learn more, please visit the original sources at reference link below.
References:
- Diane Tang and Carrie Grimes. Udacity