Multiple Linear Regression
In this blog, we want to discuss multiple linear regression. We will be including features numerical and categorical variable, and feed those into the model.We will be discuss how to select which features are significant predictor, and perform diagnostic.
Screenshot taken from Coursera 00:33
Conditions and Inference of Linear Regression
Up until know, you should now intuitively that linear regression is the least squares line that minimizes the sum of squared residuals. We can check the conditions for linear regression, by looking at linearity, nearly normal residuals, and constant variability. We also looking for linear regression of categorical variables, and how to make inference on it.
Introduction to Linear Regression
So far we've been looking into the problem where we have single categorical/numerical, relationship between categorical-numerical or categorical-categorical. In this blog, we're going to discuss about two numerical variables. We have a correlation test, want to test the strengthness relationship of both numerical variables, inference, and introduction to linear regression.For those that familliar with machine learning, this blog will make additional flavour from statistics.Why is it call linear regression? Because it's all about regress towards the line.
Comparing categorical proportions and Chi-Square
Earlier we compute hypothesis testing and confidence interval for proportions, but what if succeses and failures conditions are not met? In this blog, we choose the alternative way, doing simulation
Screenshot taken from Coursera 03:07
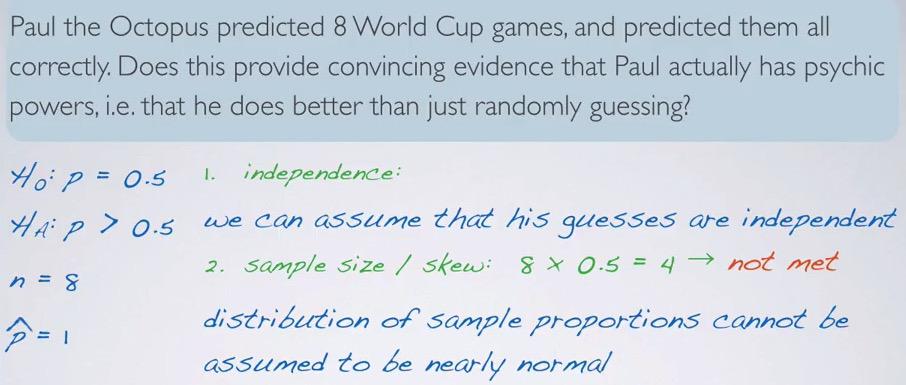
So here we take a real problem. Paul the octopus can predict all 8 world cups game correctly. He only have two choices, so we can expect there are two possible outcome. The null hypothesis states his choice are random and have 50% chance. The alternative hypothesis would be paul is better guess than just random. Then we set null and alternative hypothesis test. But we have one problem, we have too small sample size. What do we do?
Hypothesis Testing and Confidence Interval for Categorical Variable
Screenshot taken from Coursera 03:42
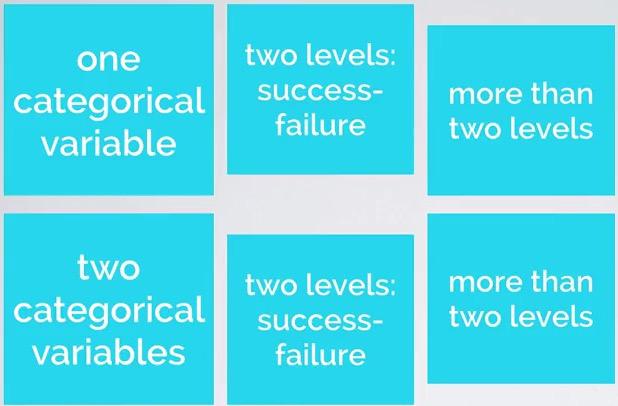
In numerical variable, you want to take the average mean and infer the average and the differences. In categorical variable, you take the proportion of frequency, you may want to perform some contigency table.Studies that take percentage are likely categorical variables (XX% support vs XX% oppose same sex marriage).
In this blog we're going to observe one categorical variable. We talk about binary classification, and then more than two classification. Then we're going to compare two categorical variables, again with binary classification and more than two classification.
t-distribution and ANOVA
Big Data is the terms that comes a lot in the data scientist. Is big data equals accuracy? Not necessarily.We've seen enough examples where the data is small, but enough for many statistician to infer from the data. In this blog, we will discuss how we're dealing in small sample size vs large sample size and make inference based on it.
Paired data and Bootstrapping
This will become the foundation for the inference for numerical variables. This blog will discuss how to compare mean for each of the group.Specifically how we can make inference other than CI(because median and other point estimate can't be fit in CLT). We also learn how to do bootstrapping (randomize permuation for each step), working for small example(less than 30, like t-distribution), and comparing many means (ANOVA).
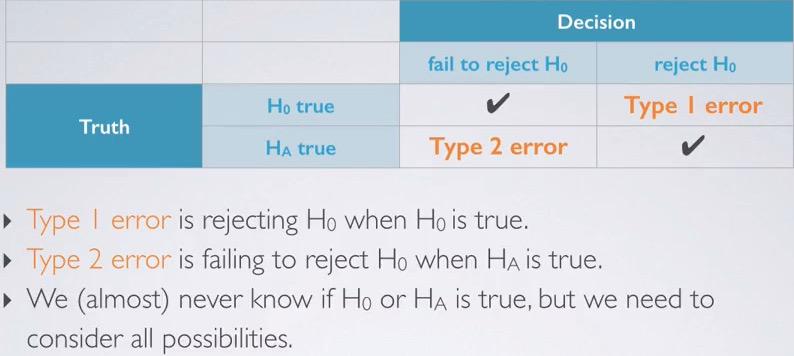
Decision Hypothesis Testing and Confidence Interval
Decision Errors
Sometimes in you have decision case where error like innocent people go to jail, or bad people not guilty.You have to balancing this error. Decision Errors is like precision and recall. You have type 1 error and type 2 error that this is inversely proportional. You have to make a judgement based on this decision.
Hypothesis Testing
Snapshot taken from Coursera 04:09
Earlier in my blog post, we have learn about hypothesis testing. Based on the difference of 30% in female vs male being promoted, we want to know if the difference makes two variable independent vs dependent. The Null Hypothesis said that is due to chance. The alternative said, there's dependant variable and some relationship. Using simulation earlier we know that achieving 0.3 is very rare using simulation. If there's no strong evidence, we stick to the Null Hypothesis, but if we do we reject the Null Hypothesis in favor of the alternative. We can do this by using CLT, like in the Kloud score example.
In a way, Hypothesis Testing is similar to what we do in court trial. There's skeptical that judge whether the one in court is guilty or not guilty. The judge will pressume that the man is innocent, until strong evidence prove that the judge reject the innocent and set him guilty. The court is not about the evidence, it's about whether it reject, or fail to reject the innocent.
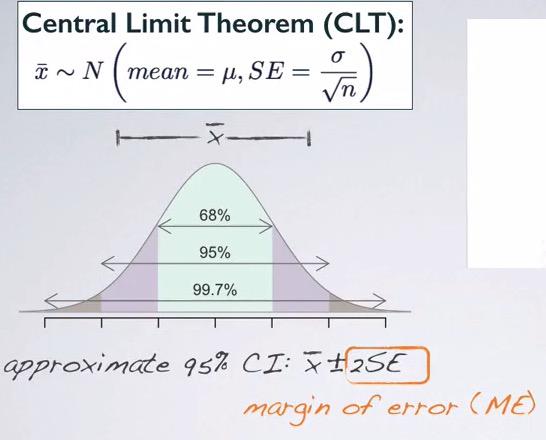
Confidence Interval
Confidence Interval (CI)
Confidence interval is the range of plausible values in which we want to capture the population parameter. For example if estimate the point estimate, if we guess the exact value chances are we will miss. But if we take range of plausible values (net fishing instead of doing it with spear), there's a good chance that we capture population parameter.Note that sample statistics acts as a point estimate to our population parameter. So if we want to get a population mean, we get a point estimate mean. In this case, the sample statistics and point estimate is synonymous.